Tag Archives: Matlab

Matlab : GUI

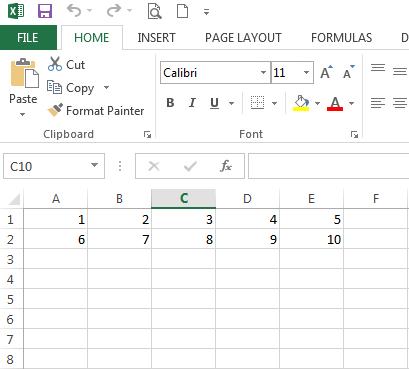
This chapter will discuss about using Matlab fuzzy toolbox. Suppose you already have data and want to process the data using fuzzy. In general, you should follow this block diagram.

Data -> Pre process -> Decision Function

To start the tutorial, we will create simple GUI to simplify our work.

Write guide command in command window and save it. It will create two files which are one .m file and one .fig file. For example we save with name “Workshop2” so it will create two file Workshop2.fig and Workshop2.m in your folder.

> guide

untitled-1

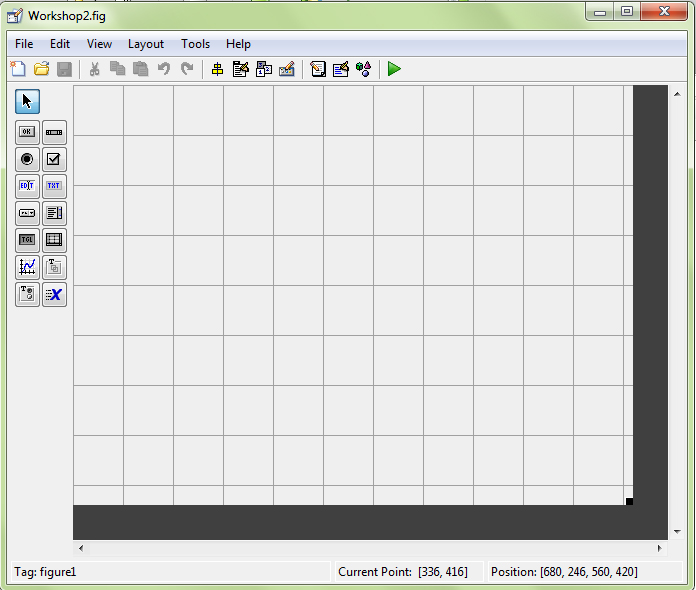
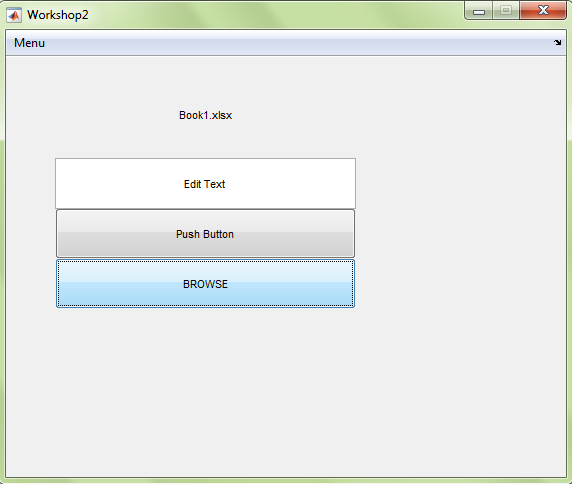
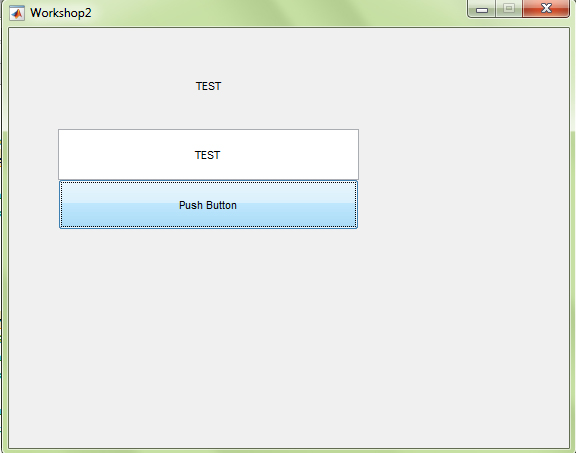
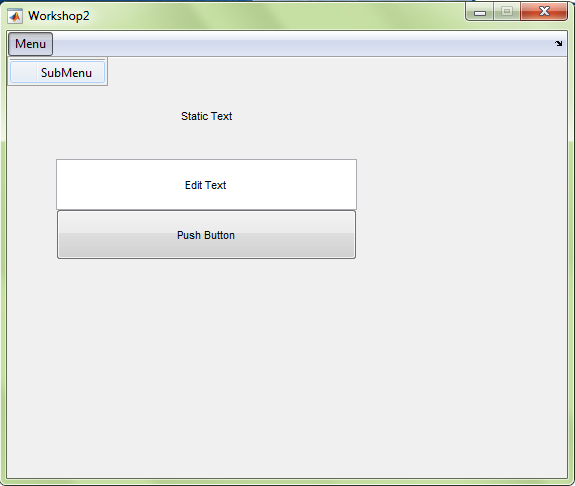
Drag the Edit Text, Static Text, and Push Button on the left to the figure. The appearance become like this.

untitled-21

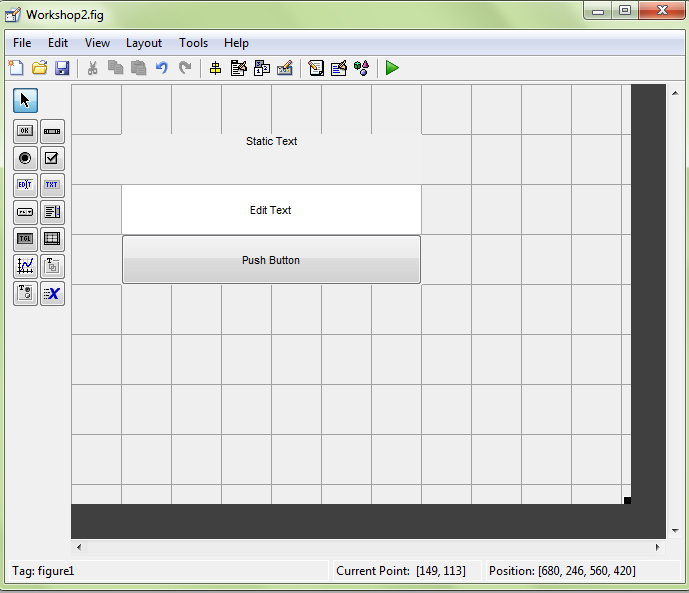
Now we will learn how to get input from Edit Text when we push the Push Button.

Go to your Push Button code in Workshop2.m and write this code.

untitled-33

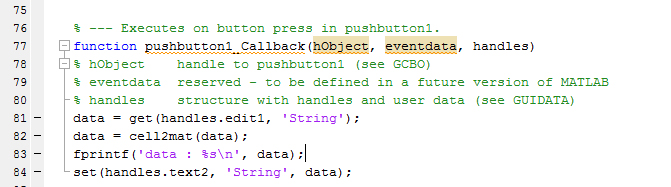
Now run the figure and write anything in the Edit Text. For example we write “TEST” in the Edit Text and press the Push Button then the text will show in Static Text as “TEXT”.

untitled-31

Now we will use custom function in the GUI. This function will detect odd or even based on the input value in Edit Text and show it on Static Text.

function result = detectoddeven(input)

if (mod(input, 2) == 0)

result = ‘EVEN’;

else

result = ‘ODD’;

end

end

Save it to detectoddeven.m and in the Workshop2.m under Push Button section we write this code.

untitled-35

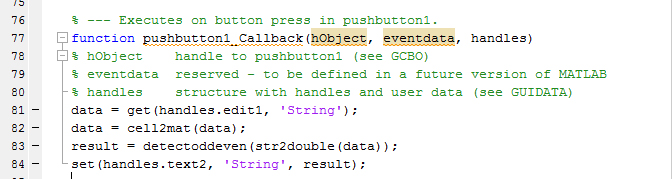
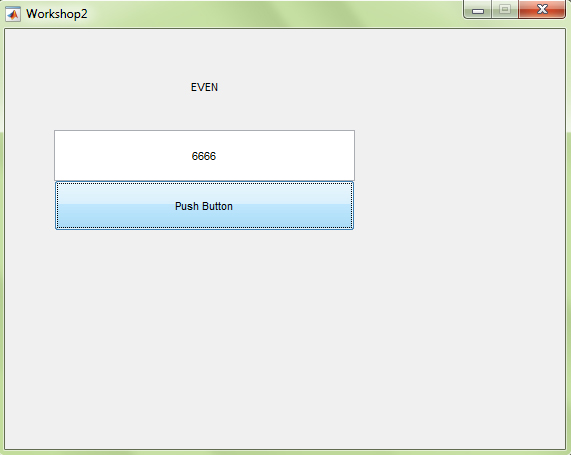
If we run the program and set input with value 6666, the program will detect the value as “even”

untitled-34

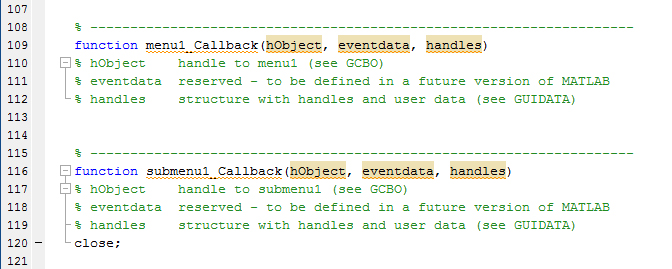
Now we want to create menu in the GUI using menu editor.

untitled-38

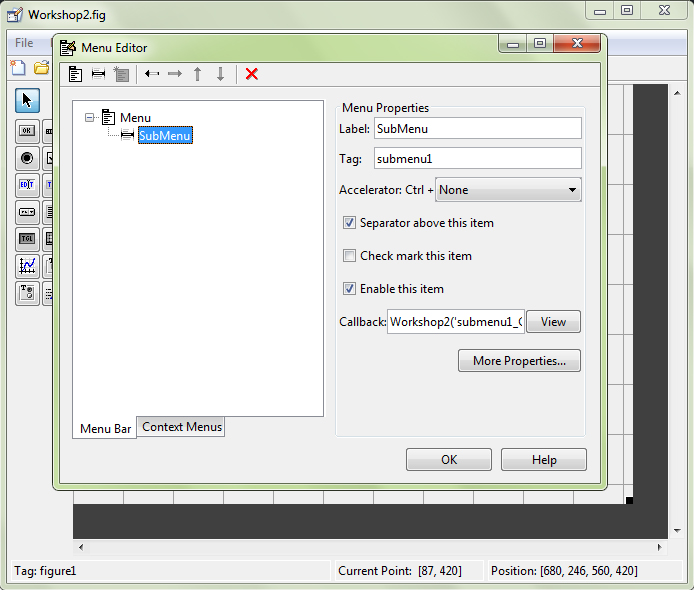
We will create if Menu -> SubMenu is clicked then the GUI will close with this code

untitled-37

And the result

untitled-36

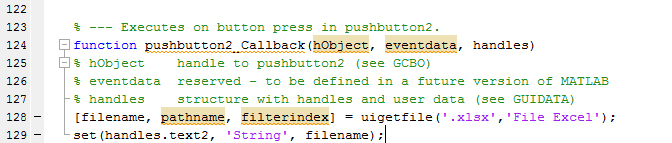
We want to browse through the explorer and get an item from it to show the filename on Static Text. First we create one more push button and name it “BROWSE” and in the Workshop2.m under pushbutton2 section we add this code

untitled-39

And the browse dialog will be

untitled-40

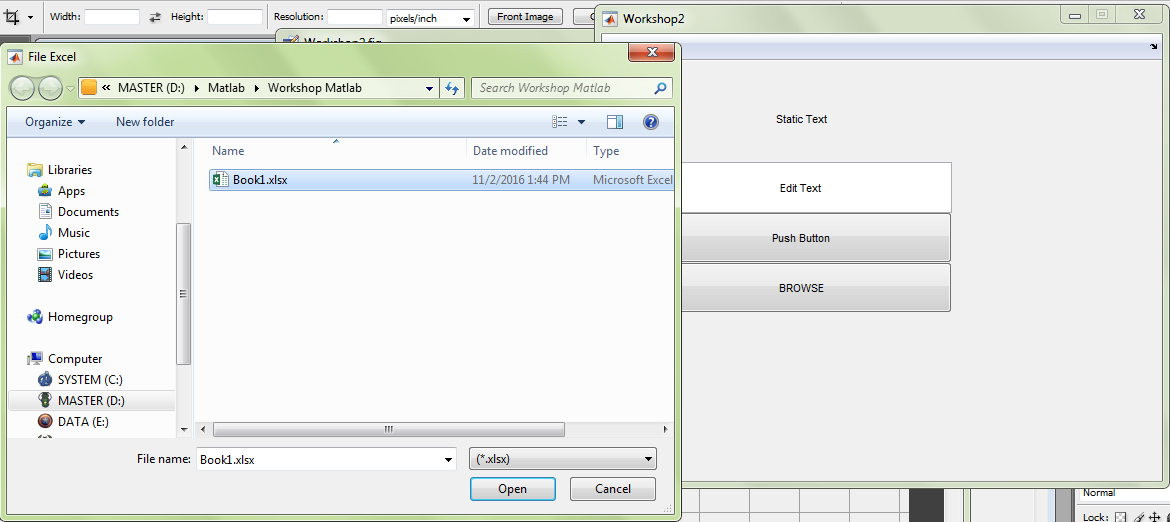
When we choose a file and click Open then the filename will be shown in Static Text

untitled-41


Matlab : Graphs

This chapter will explain common plot function in Matlab. To draw graphics in Matlab we can use plot() function as defined below:

Syntax :

x = -pi:pi/10:pi;
y = tan(sin(x)) – sin(tan(x));
plot(x,y,’–rs’,’LineWidth’,2, ‘MarkerEdgeColor’,’k’, ‘MarkerFaceColor’,’g’, ‘MarkerSize’,10);

Where :

x is the axis range

y is the result

‘–rs’ is the line model which is double strip –, “r” for red color and “s” for square marker

‘LineWidth’ determines the line width which is 2

‘MarkerEdgeColor’ determines the marker edge color which is ‘k’ for black color

‘MarkerFaceColor’ determines the marker face color which is ‘g’ for green color

‘MarkerSize’ determines the marker size which is 10

Result :

untitled-5


To add two graphics in Matlab we can use plot() function followed by hold on and hold off as defined below:

Syntax : 

x = linspace(0,2*pi,60);
a = sin(x);
b = cos(x);
plot(x,a+b);

hold on
stem(x,a,’b’);
stem(x,b,’r’);
hold off

Result :

untitled-6


To add title and axis label we can use title() and axes([xmin xmax ymin ymax])

Syntax :

x = [1 3 0.5 2.5 2];
pie(x);

explode = [0 1 0 0 0];
pie(x, explode);

title(‘Pie Demo’);

Result :

untitled-7


To draw 3D graphics we can use meshgrid()

Syntax :

[x,y] = meshgrid(-8:0.5:8);
R = sqrt(x.^2 + y.^2) + eps;
Z = sin(R)./R;

mesh(Z);

Result :

untitled-8


To show some graphics in one figure we can use subplot() function

Syntax :

n = 0:0.5:2*pi;
x = cos(n);
y = sin(n);

hold on
subplot(2,1,1); plot(n,x);
title(‘cosinus n’);
xlabel(‘number of samples’);
ylabel(‘value’);
subplot(2,1,2); plot(n,y);
title(‘sinus n’);
xlabel(‘number of samples’);
ylabel(‘value’);
hold off

Result :

untitled-9


Matlab : Matrix

In this chapter


Matrix Declaration

If we have matrix x = [1 2 3

4 5 6]

In Matlab, matrix’s column is separated with comma “,” or space ” ” and the row is separated with semicolon “;”

Syntax :

>> x = [1, 2, 3; 4 5 6;]

Result :

x =

1 2 3
4 5 6


Indexing a matrix

Matrix in Matlab is constructed row wise as shown below :

Suppose we have matrix A = [1, 2; 3, 4]. So the index will be:

A(1) will address to 1

A(2) will address to 2 not 3

A(3) will address to 3 not 2

A(4) will address to 4


Get element matrix

The element of a matrix 2D is in A(index of row, index of column) and for matrix 3D is A(index of row, index of column, index of dimension) and so on.

Suppose we have matrix B = [4, 2, 5; 7, 8, 11; 2, 0, 9]. So to get 0 we use B(3, 2)


Get sub matrix

To extract sub matrix from a matrix we can use interval as defined below :

Suppose we have matrix C = [1, 2, 3; 4, 5, 6; 7, 8, 9]. To extract the second row from matrix C we use :

subC = C(2,:); or C(2,1:3);

The colon operator means interval (see for loop in previous chapter) so if we write 1:3 then it means 1 to 3.

To extract 5, 6, 8, 9 we can use

subC = C(2:3, 2:3);


Special matrix function

Matlab provides a function to generate matrix with predefined value :

D = zeros(3, 3);

That syntax will create matrix D with size 3×3 and 0 for all its element

The other function is ones(m, n), eye(n), etc


Matrix operation

The operator + (addition), – (subtraction), * (multiply), / (divide) can also be used in matrix.

Suppose we can use + in A + B where A and B is matrix to perform addition matrix A and B

The multiply “*” operator performs normal matrix multiplication but if we add dot in front of the operator, it will perform element wise operation.

Suppose we have two matrix A and B and perform element wise multiplication on them

C = A .* B (element wise multiplication)


find() function

The find() function is useful for extracting value in the matrix which match the given condition.

Suppose we have matrix A = [1, 2, 3; 4, 5, 6; 7, 8, 9] and we want to find any value in the matrix which larger than 5.

>> find(A > 5)

ans =

3
6
8
9

The find() function return linear index of the matrix which contain the result of condition. As in the example the index value is A(3) = 7, A(6) = 8, A(8) = 6, A(9) = 9


reshape() function

Matrix dimension can be manipulated using reshape() function. For the example :

Suppose we have matrix 3 x 3 in A = [1, 2, 3; 4, 5, 6; 7, 8, 9] and we want to reshape the matrix into 1 x 9. We can use :

reshape(A, 1, 9)

where A is the matrix, 1 is the number of row and 9 is the number of column


min() and max() function

To extract minimum value or maximum value of matrix we can use min() and max() function. As default Matlab return the minimum or maximum value in column wise so the value is the minimum or maximum from every column


Saving matrix into Excel format

We can use xlsread() and xlswrite() to read excel data and write matlab data to excel format

[numeric, text, raw] = xlsread(file, sheet, range);

We can define the output as numeric or text or raw which extract all information in the excel

Suppose we have excel file :

untitled-2

Syntax :

[numeric text raw] = xlsread(‘Book1.xlsx’,’Sheet1′);

Result :

untitled-3

To extract specific range from the excel sheet we can provide the third input parameter. Suppose we want to extract data from A1 to A3 so we can write :

[numeric text raw] = xlsread(‘Book1.xlsx’,’Sheet1′,’A1:A3′);

Write data to excel

Suppose we have matrix A = [1, 2, 3, 4, 5; 6, 7, 8, 9, 10]. We can write the matrix into excel format. From this example we will write matrix A into Sheet2 in our excel file

Syntax :

A = [1,2,3,4,5;6,7,8,9,10];
xlswrite(‘Book1.xlsx’,A,’Sheet2′);

Result : 

untitled-4


Saving matrix into .mat


Matlab : Looping

This chapter will cover the use of common syntax for looping in MATLAB such as for and while.


For Loop

This is an example how to use “for” loop in MATLAB. We define the number iteration as n = 3 and update the value of f = 1 in each iteration with f * i where i is the iteration index. The value of f from each iteration will be displayed in the command window with disp() function.

Syntax :

n = 3;

f = 1;

for i = 1:n

f = f * i;

disp(f)

end

Result :

>>

1

2

6


While Loop

This is an example how to write “while” loop in MATLAB. From this example, we set i as 3 and decrease its value as long its larger than 0. The disp() function will show the updated value of i along time.

Syntax :

% while loop

i = 3;

while (i>0)

disp(i)

i = i – 1;

end

Result:

>>
3

2

1